Translates yield curve modeling into pricing modules, risk reports, and scenario tooling.
Research-Style Paper
From Yield Curves to Trading Tooling: Quant Engineering Notes
A public-safe note on connecting fixed-income concepts to reproducible tooling for pricing, risk, scenario analysis, and trading-system assumptions.
Domain: Quant Engineering
Focus: Fixed Income and Tooling
Year: 2026
Status: Portfolio Note

Fast Scan
What this paper proves
This note shows how financial math becomes software that can be tested, audited, and extended.
Separate market data, curve construction, instrument pricing, risk metrics, and reporting layers.
Validate formulas, stress assumptions, compare baselines, and test edge cases before trading use.
No investment recommendation, live PnL claim, broker credential, or proprietary trading data is published.
Abstract
Yield curve work is often presented as a math exercise, but the engineering challenge is to make the assumptions inspectable. A useful tool should separate data ingestion, curve construction, instrument pricing, risk metrics, and scenario reporting. That separation makes it easier to test each layer, explain model outputs, and decide what would need to change before connecting the tool to live trading infrastructure.
Problem
Fixed-income analytics depends on assumptions about market data quality, interpolation, compounding, day-count conventions, liquidity, and transaction costs. When these assumptions are buried in a spreadsheet or a script, reviewers cannot easily tell whether a result comes from market movement, model choice, or a data-quality issue. The portfolio problem is to show a clean engineering path from finance theory to reviewable tooling.
Data Boundary
Public notes should use synthetic examples, public references, or abstracted market-data concepts. They should not expose broker credentials, private orders, account identifiers, live positions, internal logs, or strategy parameters. Where production metrics are unavailable, the writeup should say what would be measured rather than imply live trading performance.
Field Note
The thing I want a reviewer to notice is not that I can draw a curve. It is that I care where each assumption lives and how a wrong convention would surface in testing. My trade-off is to keep the public version conservative: analytics and tooling evidence first, live-trading claims only when there is audited proof.
Method
Architecture
Quant Tooling Flow
Market inputs
Rates, maturities, conventions, and quality checks.
Curve engine
Interpolation, discount factors, and scenario construction.
Pricing engine
PV, yield, duration, convexity, Greeks, and stress outputs.
Decision surface
Reports, dashboards, alerts, and trading-tool integration assumptions.
A senior reviewer should be able to inspect the path from input to output. That means the tool needs versioned assumptions, deterministic tests for formulas, scenario labels, and logs that explain why a result changed. If the tool connects to trading infrastructure, order lifecycle, latency, risk limits, and failure recovery become separate engineering concerns.
Visual Evidence Strip
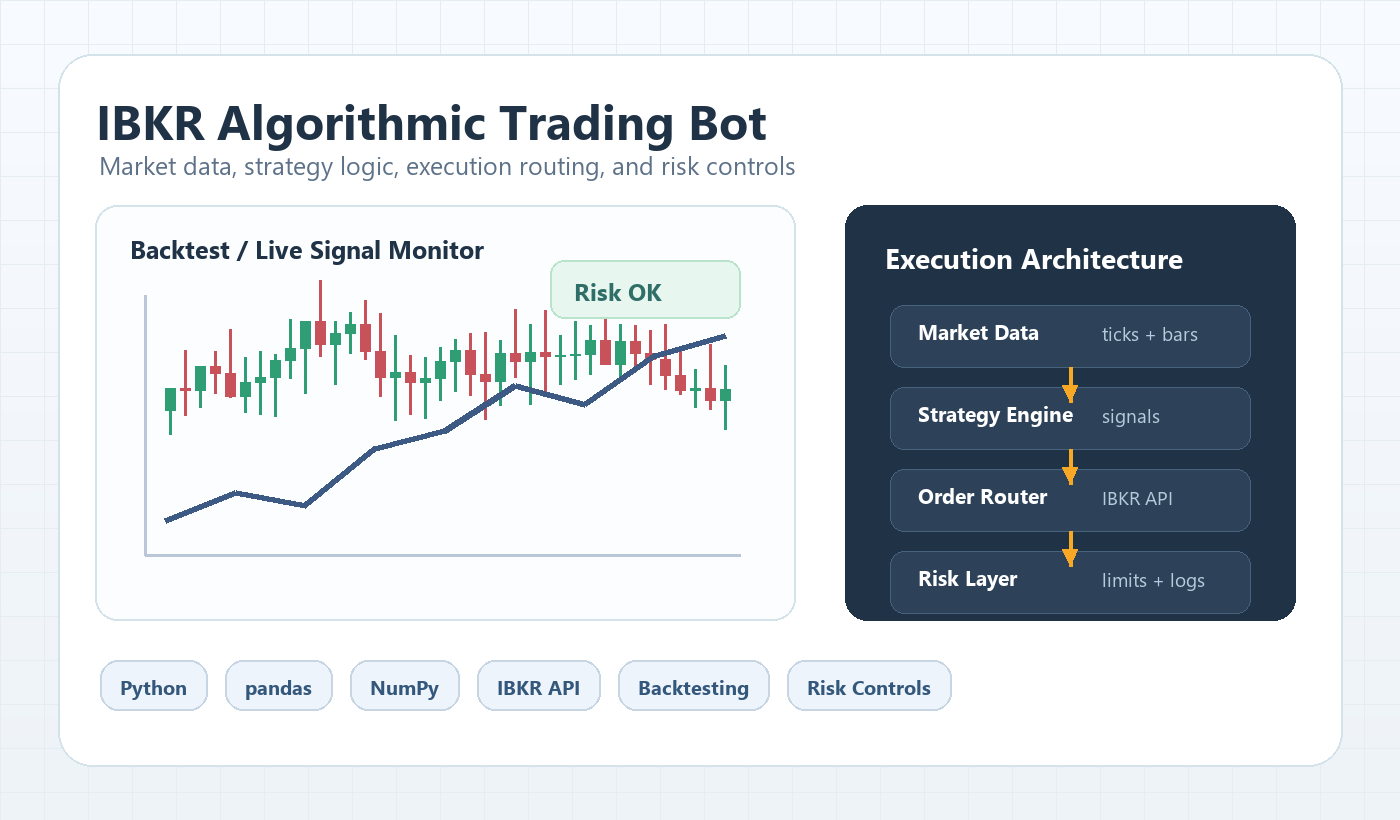
These visuals turn the quant narrative into inspectable artifacts: a curve model, an execution boundary, and the risk layers that should sit between research and trading.
Short Demo Clip
This silent walkthrough shows the engineering boundary between market inputs, curve assumptions, pricing, risk checks, and paper-routing traces.
Assumptions to risk output
Shows how inputs move through curve construction, scenario shock, pricing, risk limits, and reportable output without implying live trading performance.
Transcript
Market inputs enter the curve engine with convention checks. Scenario assumptions flow into pricing and risk calculations, risk limits and paper-routing boundaries sit before execution, and the final artifact is the trace from assumptions to risk output.
Evaluation
I would evaluate the analytics layer against hand-calculated examples, textbook baselines, and edge cases such as near-zero maturity, negative rates, missing tenors, and unusual day-count conventions. For tooling, I would test reproducibility, input validation, scenario consistency, report readability, and how safely the system handles missing or stale market data.
Trading boundary: A research tool can demonstrate quant and engineering judgment
without claiming it is a live trading strategy. Live deployment would require risk controls,
transaction-cost modeling, broker integration tests, and monitored paper trading.
Limitations
Yield curve tools are sensitive to data quality and convention choices. A clean dashboard can still produce misleading results if the curve construction assumptions are wrong, if liquidity is ignored, or if transaction costs are absent from strategy testing. The public note therefore frames the work as analytics and tooling design, not as an investment recommendation.
What I Would Improve Next
- Add unit tests for pricing, duration, convexity, interpolation, and scenario transformations.
- Build a small assumptions panel that makes conventions visible beside every result.
- Add paper-trading telemetry for order state, slippage assumptions, and drawdown limits.
- Compare curve construction choices across interpolation methods and stress regimes.